Introduction:
Monitoring in the dynamic world of DevOps can be complex, but it’s essential for ensuring the performance and health of your applications and infrastructure. In this article, we’ll explore a selection of popular Kubernetes monitoring tools, helping you make an informed choice tailored to your specific needs.
Key Metrics to Monitor Before delving into the tools, let’s categorize the metrics into two groups:
Resource Utilization:
These metrics include CPU, memory, and disk usage at different levels like the cluster, node, pod, and container. They play a crucial role in optimizing resource allocation and ensuring cluster health.
Application Performance:
These metrics vary depending on your application’s nature, such as API response time, request latencies, error rates, and throughput. They provide insights into the effectiveness of your applications.
Tools for Kubernetes Monitoring
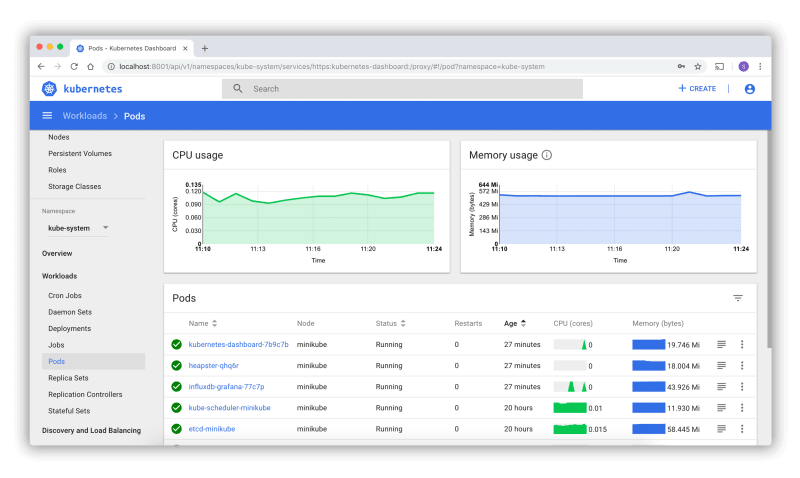
Kubernetes Dashboard (GitHub Link)
Kubernetes Dashboard is a user-friendly web interface designed for monitoring and managing Kubernetes clusters. It offers a basic overview of cluster performance, resource utilization, and application management. While simple, it lacks advanced visualization options and resource metrics.
cAdvisor (GitHub Link)
cAdvisor is an open-source container monitoring tool integrated into Kubernetes. It collects container metrics, including CPU and memory usage. It’s a straightforward option but often used in conjunction with other tools like Prometheus and Grafana for comprehensive monitoring.

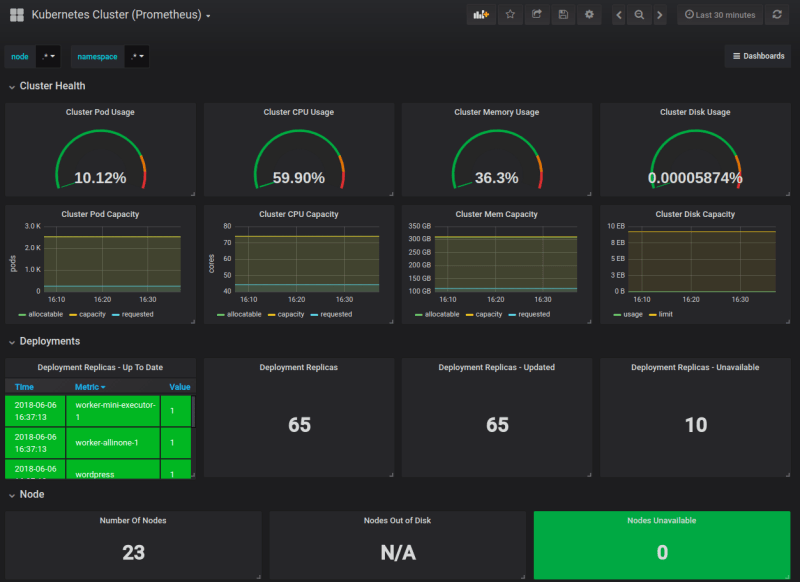
Prometheus (Official Website)
Prometheus is a leading open-source monitoring solution and a standard for Kubernetes monitoring. It comprises components for metric management, alerting, and exporting. While it excels in data collection, it lacks built-in visualization features. Users often pair it with Grafana for powerful visualization.
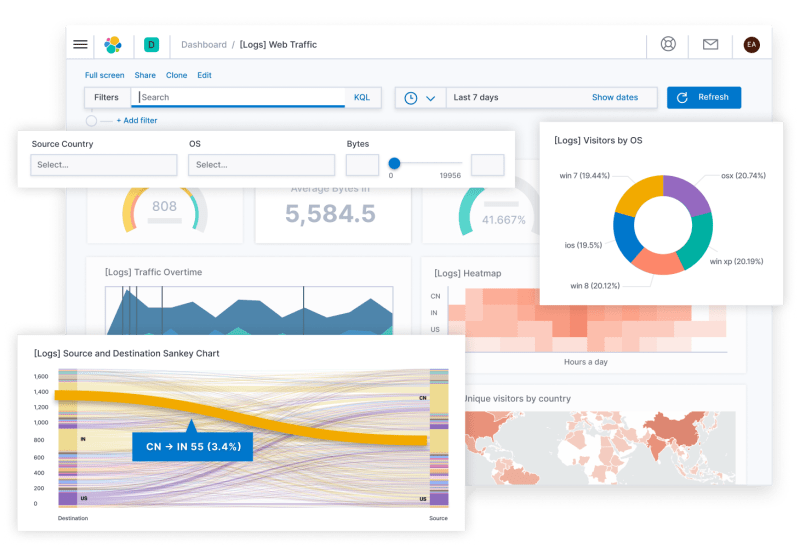
OpenSearch (OpenSearch Website)
OpenSearch is an open-source alternative to the ELK (ElasticSearch, Logstash, Kibana) stack. It offers robust log analysis capabilities, making it suitable for comprehensive monitoring. OpenSearch is known for its strong community support and compatibility with Kubernetes.
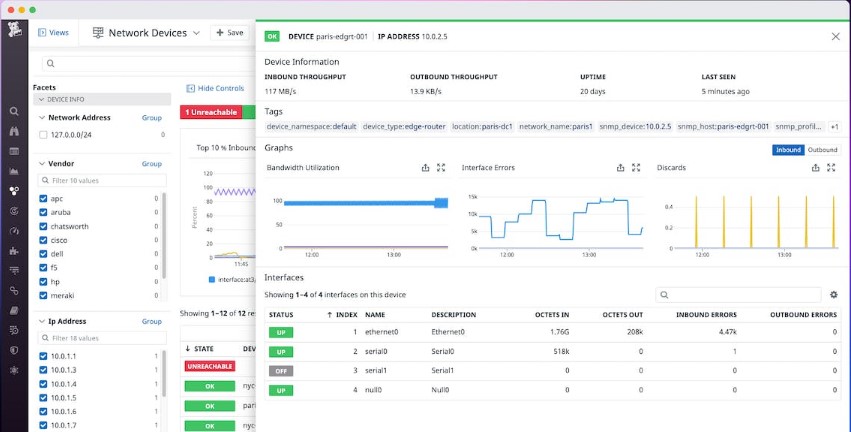
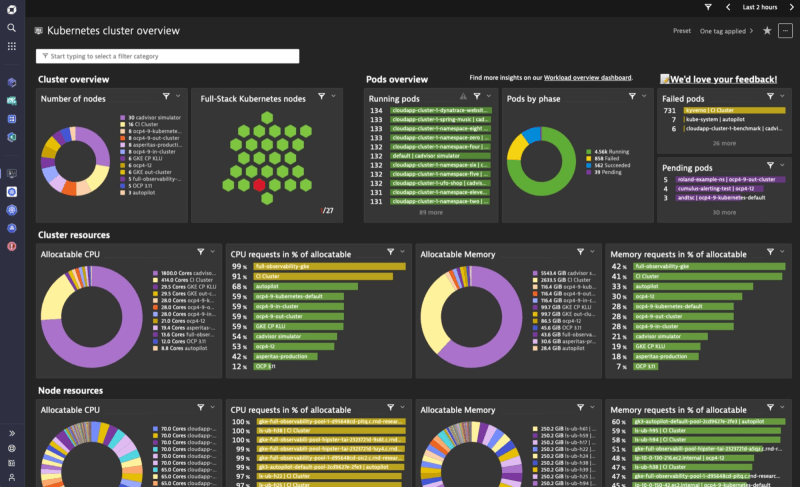
Datadog (Official Website)
Datadog is a comprehensive full-stack monitoring solution, covering infrastructure, security, and application monitoring. It provides insights through end-to-end monitoring, resource metrics, and data correlation. However, it may require intricate initial setup and careful budget management.
Dynatrace (Official Website)
Dynatrace is a paid full-stack monitoring solution known for its user-friendly setup and effective tracking of metrics in complex systems. It’s suitable for those focused on application monitoring, and it offers unified monitoring across various cloud platforms.
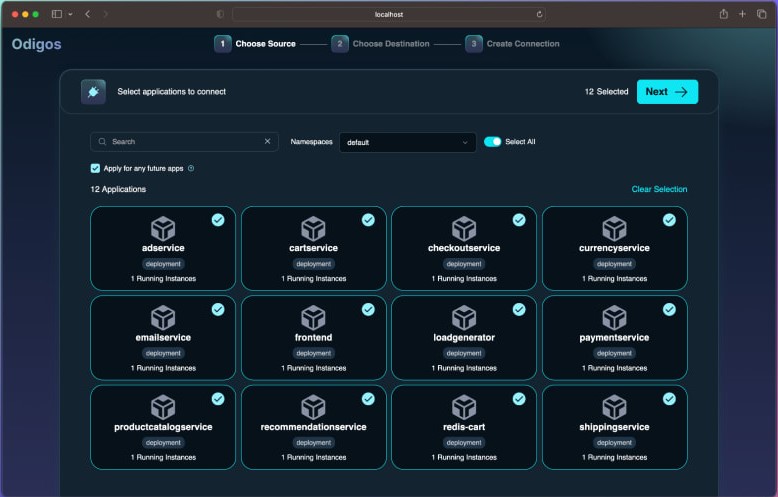
Odigos (Official Website)
Odigos is a unique open-source platform that automatically generates distributed traces, metrics, and logs without code changes. It’s beginner-friendly and ideal for quick instrumentation without altering your code. It seamlessly integrates with existing monitoring solutions.
Conclusion
Choosing the right Kubernetes monitoring solution depends on factors like features, cost, ease of use, and scalability. Each tool has its strengths and weaknesses, so it’s crucial to evaluate them based on your specific requirements. With this understanding, you can make an informed decision to enhance your DevOps practices and ensure the reliability of your applications and infrastructure.